


I once spent an entire evening trying to figure out why three different dashboards gave me three different answers about the same campaign. One said I’d made twelve sales. Another said nine. My bank account said seven. I closed my laptop, ate cereal for dinner, and made a decision: I would stop trying to find the one perfect number and start building a system I could actually trust.
If you’ve felt that frustration, you’re in good company. Tracking has never been messier. AI assistants send traffic that analytics sometimes files as “direct.” Ad platforms change how they count conversions. Search results show AI answers without click data. And customers hop between social, search, email, and in-person before they buy.
Here are a few recent examples of what’s shifting:
- Meta is rolling out a Pixel setting that counts conversions measured on a customer’s device, which can change your reported results overnight.
- Google Ads’ Data Manager will no longer require customer lists to be hashed before upload, simplifying how some data is sent.
- TikTok’s attribution tools have shown that standard reporting can miss a lot of cross-channel influence.
- Google Search Console still doesn’t provide clicks for AI results, so AI visibility is hard to measure directly.
- Email metrics shifted when AI summaries began inflating opens.
In this guide, I’ll show you a simple marketing measurement system for small businesses that works even when individual tools disagree.
The Big Idea: Measure Outcomes, Triangulate Sources
No single dashboard tells the whole truth. Instead:
- Start with business outcomes in your own records: sales, leads, bookings, and revenue.
- Use platform data as directional, not final.
- Compare several signals and look for agreement.
- Track trends over weeks, not days.
Here’s the truth: if your bank account and your CRM agree, trust them over a dashboard that doesn’t.
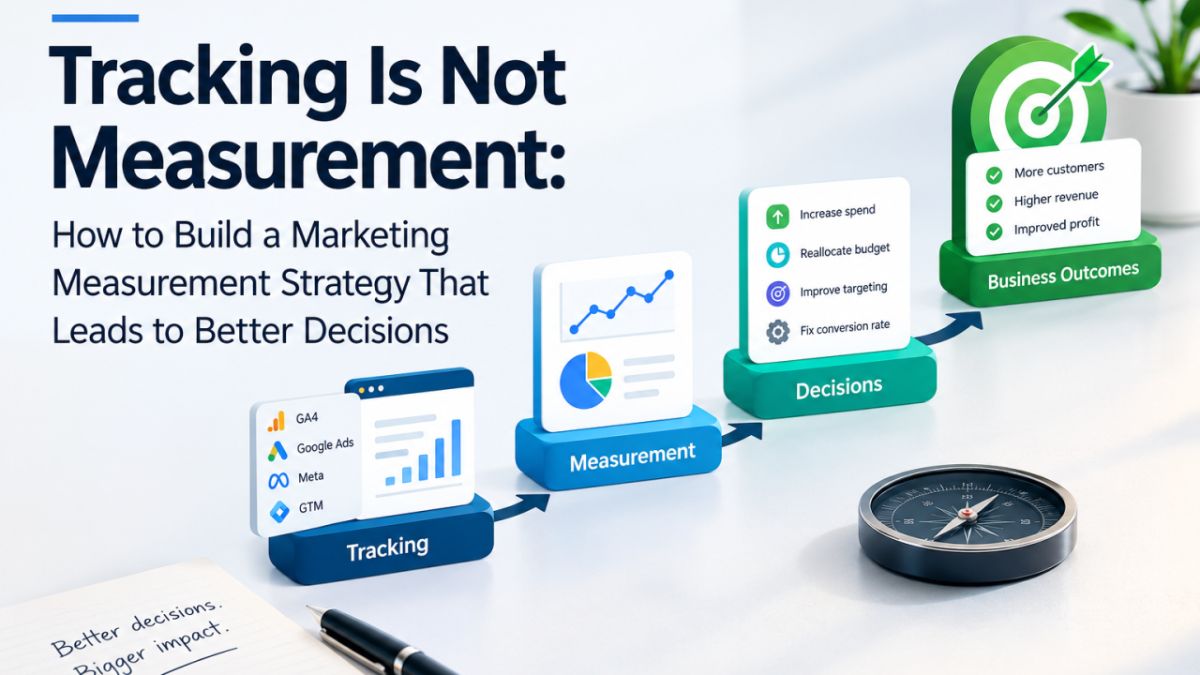
Step 1: Choose Five Numbers That Matter
Pick a small set of metrics you’ll review every week:
- Revenue or qualified leads (from your own records)
- Marketing spend (total across channels)
- Cost per acquisition (spend divided by new customers)
- Conversion rate on your website or booking page
- Customer lifetime value or repeat purchase rate, if you can estimate it
Everything else is secondary. Too many metrics become noise.
Step 2: Set Up Clean Tracking Basics
- Install analytics correctly and define key events (purchase, signup, booking).
- Use UTM tags on every link you control: emails, social posts, partner pages, and ads.
- Set up the ad platform tags you need, such as the Meta Pixel and Conversions API, TikTok Pixel, and Google tag, and test them.
- Create a custom channel group for AI sources in your analytics so assistants like ChatGPT aren’t buried in direct traffic.
- Annotate big changes: platform bugs, settings switches, new campaigns, and site updates.
When a platform changes a measurement setting, note the date and compare your numbers before and after so you can tell a real change from a counting change.

Step 3: Ask Customers (the Low-Tech Superpower)
Self-reported attribution catches what trackers miss. Add one question to your checkout, booking form, or onboarding:
“How did you first hear about us?”
Use a dropdown with options like Google, AI assistant, Instagram, TikTok, YouTube, a friend, email, and other, plus a short text box. Review answers monthly. Many businesses find their “direct” and “organic” traffic hides influence from social video and AI recommendations.
Step 4: Build a One-Page Dashboard
Combine the numbers in a simple spreadsheet or dashboard tool, updated weekly:
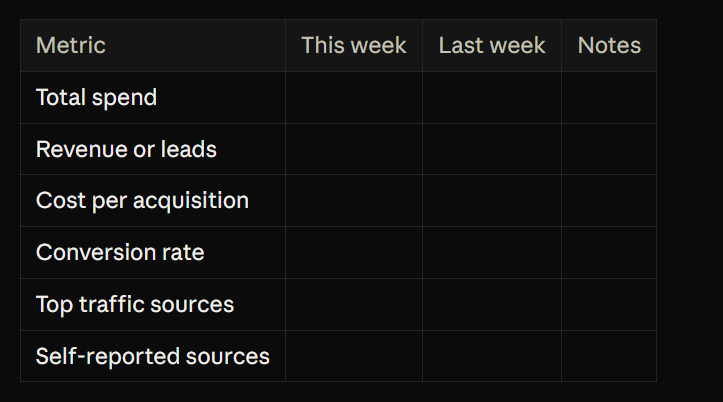
Add a notes column for anything unusual: promotions, outages, tracking changes, or holidays.
Step 5: Run Small Experiments
When you want to know if a channel is really working, test it simply:
- Holdout test: Pause a channel for a short period (when it’s safe) and see what happens to total sales.
- Geo or audience split: Run ads in some areas or segments and not others, then compare.
- Before-and-after test: Make one change and track the same metrics for a few weeks.
- Promo codes or dedicated links for each channel.
These won’t be perfect, but they reveal more than arguing about which dashboard is right.

Step 6: Understand Each Channel’s Blind Spots
- Paid social: Platforms may over-claim credit for conversions that would have happened anyway. Compare against total sales.
- Search: AI answers can influence people who never click. Watch branded search growth and direct traffic as signals.
- Email: Open rates are inflated by AI summaries. Focus on clicks, replies, and revenue per recipient.
- Organic social: Influence often shows up later as direct or search traffic.
- AI assistants: Referral tags can be missing or change without notice, so rely on trends and customer answers.
Step 7: Respect Privacy and Compliance
Measurement tools collect data about real people. Be a good steward:
- Follow privacy laws and platform rules that apply to you and your customers.
- Use clear consent where required, and keep a privacy policy updated.
- Collect only what you need.
- Be careful with uploaded customer lists, and use trusted tools.

What to Do When Numbers Disagree
- Check dates and time zones. Mismatched ranges cause confusion.
- Compare definitions. One tool’s “conversion” may not match another’s.
- Look at the trend, not the exact figure.
- Check your source of truth: bank deposits, CRM entries, and order records.
- Note platform changes that might explain a jump or drop.
- Don’t change strategy based on a single odd day.
Mistakes to Avoid
- Chasing perfect attribution.
- Trusting any single dashboard.
- Ignoring tracking after platform updates.
- Skipping UTM tags.
- Measuring clicks instead of customers.
- Forgetting to ask customers.

Your 7-Day Measurement Setup
- Day 1: Choose your five key numbers.
- Day 2: Check your analytics events and ad tags with test conversions.
- Day 3: Create UTM links for your main campaigns.
- Day 4: Add a “How did you hear about us?” question.
- Day 5: Create a custom channel group for AI traffic.
- Day 6: Build your one-page dashboard.
- Day 7: Schedule a 30-minute weekly review.
Build a System, Not a Pile of Dashboards
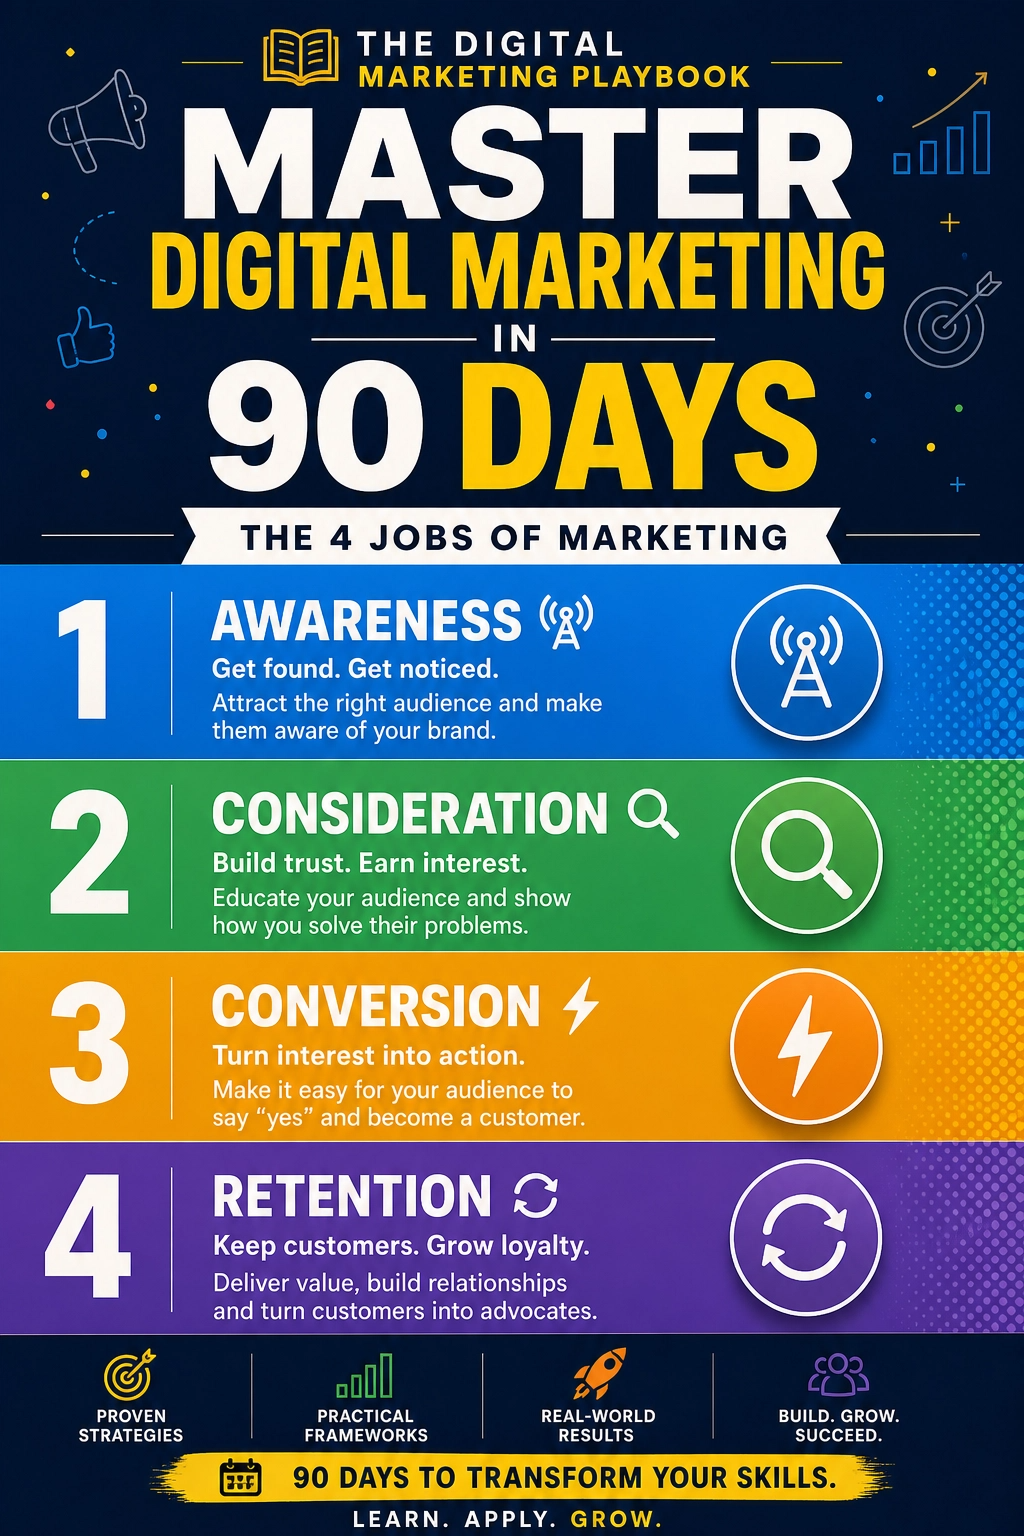
Good marketing decisions come from a simple, consistent view of what’s working. If you’d like a step-by-step guide to building a marketing system with clear goals and measurement, take a look at my ebook:
The Digital Marketing Playbook
Trust me, a calm weekly review beats a late-night dashboard spiral.
Final Thoughts
Marketing measurement will probably stay imperfect. The goal isn’t perfect data. It’s confident decisions. Pick a few numbers, clean up your tracking, ask your customers, run small tests, and compare sources. With a simple system, you can stay steady even as platforms change the rules.










Leave a Reply