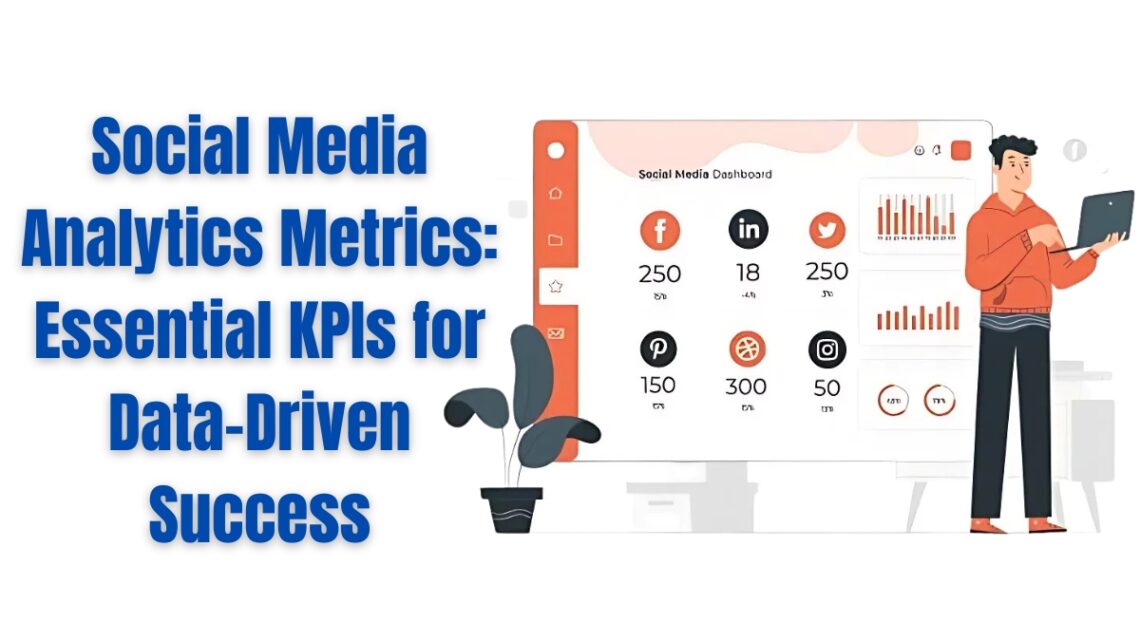
Social Media Analytics Metrics: Essential KPIs for Data-Driven Success
Did you know that 83% of marketers rely on social media analytics to make strategic decisions, yet only 30% feel confident in interpreting their metrics? In today’s digital landscape, understanding social media analytics metrics isn’t just about collecting data – it’s about extracting meaningful insights that drive real business results. Whether you’re a seasoned marketer or just starting out, mastering these essential metrics will transform how you approach social media strategy.
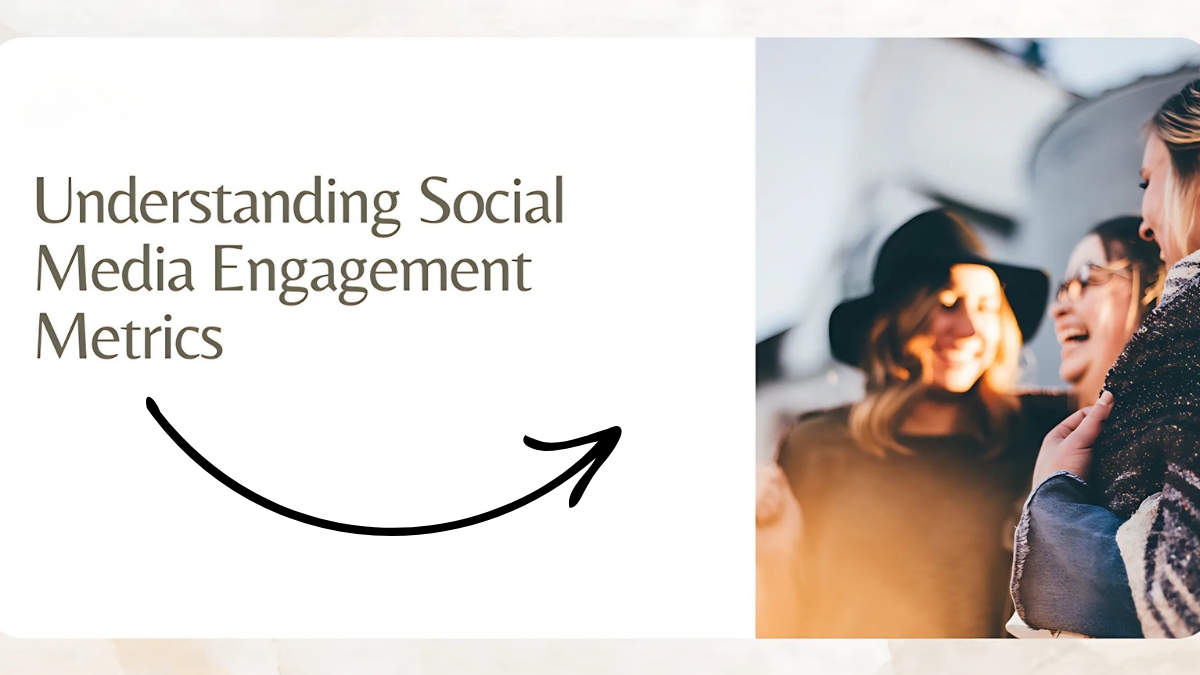
Core Engagement Metrics: Understanding Your Audience’s Interaction
First things first – let’s talk about those basic engagement indicators that everyone obsesses over: likes, shares, and comments. Back when I started, I used to think likes were everything. Boy, was I wrong! While likes are important, they’re actually the lowest form of engagement. Here’s what I’ve discovered really matters:
Comments are pure gold because they show someone took time to actually engage with your content. I’ve found that posts with 10 meaningful comments are often more valuable than ones with 100 likes. Pro tip: track your comment-to-follower ratio. Anything above 1% is fantastic for most industries.
When it comes to shares, these are basically digital gold. Think about it – someone liked your content so much they wanted their friends to see it! In my experience, shared content typically reaches 3-4 times more people than non-shared content. Keep an eye on your share velocity (how quickly your content gets shared) – it’s a huge indicator of whether something’s going to go viral.
Now, let’s clear up the eternal confusion between reach and impressions – because wow, did this trip me up when I first started! Here’s the simplest way to think about it:
Reach = unique people who saw your post Impressions = total number of times your post was seen
For example, if Sally sees your post three times, that’s one reach but three impressions. I’ve found that a healthy impressions-to-reach ratio is usually between 1.5-2.5. Anything higher might mean you’re showing content to the same people too often.
When calculating engagement rates, please don’t make the mistake I did of using the same formula across all platforms! Each platform has its own sweet spot:
- Instagram: (Likes + Comments) / Followers x 100
- LinkedIn: (Interactions + Clicks + Followers Gained) / Impressions x 100
- Facebook: (Reactions + Comments + Shares) / Reach x 100
One metric that often gets overlooked (and I kicked myself when I realized this) is saves/bookmarks. These are actually super powerful indicators of content quality. Why? Because people are literally saying “this is so good, I want to come back to it later.” I’ve noticed that content with high save rates often performs better in platform algorithms too.
As for Stories and Reels – phew, that’s a whole different ballgame! The completion rate is your north star here. From analyzing thousands of stories, I can tell you that anything above 70% completion rate is exceptional. For Reels, watch time percentage is crucial – aim for at least 75% average watch time.
Quick pro tip I learned the hard way: don’t just track these metrics in isolation. Look for patterns between them. I once had a client whose posts got tons of likes but zero shares – turns out their content was entertaining but not valuable enough to pass along. That insight completely changed our strategy.
Remember, at the end of the day, these numbers are just signals telling you how well you’re connecting with your audience. Don’t get too caught up in any single metric – it’s the overall pattern that matters. And please, please don’t compare your metrics to accounts in totally different industries. I made that mistake once and nearly drove myself crazy!
Need to calculate these metrics regularly? I’ve found that setting up a simple spreadsheet with these formulas saves hours of time each week. Just make sure you’re pulling the right numbers from your analytics dashboard – mixing up reach and impressions in your calculations can throw everything off (learned that one the hard way!).
Are you spending hours on social media every day? What if those hours could actually earn you real income? With the rise of remote work and digital marketing, there’s now a growing demand for people to manage posts, reply to comments, and engage with online communities—all from the comfort of home. Whether you’re a student, stay-at-home parent, or just looking for a flexible side hustle, this opportunity lets you turn your scrolling into something rewarding.
👉 Start today and discover how easy it is to get paid for doing what you already love—being on social media! 👉 CLICK HERE!
Audience Growth and Retention Metrics
I remember the day I realized that follower count wasn’t everything. I was celebrating hitting 10,000 followers for a client, only to discover that their engagement rate had actually dropped by 40%. Talk about a wake-up call! Here’s what I’ve learned about tracking authentic growth that actually means something:
Your follower growth rate should be calculated monthly using this formula: (New Followers – Lost Followers) / Total Followers x 100
For most accounts, a healthy organic growth rate is between 2-5% per month. Anything significantly higher might be suspicious (unless you’ve gone viral – in which case, congrats!). I learned to track this weekly to spot any unusual patterns. One time, we saw a sudden 15% spike in followers, and it turned out to be bots – not the kind of growth you want!
When it comes to audience retention, it’s all about watching your “returning follower” metrics. Here’s what I track religiously:
- Story return rate (percentage of followers who view your stories regularly)
- Post return rate (how often the same followers engage with your posts)
- Time between engagements (are people coming back daily, weekly, or monthly?)
Pro tip: Use your platform’s native analytics to create custom audiences based on engagement frequency. I’ve found that followers who engage at least once a week are 3x more likely to convert into customers or loyal community members.
Demographics analysis was a game-changer for me. Don’t just look at age and location – dig deeper! I discovered that one client’s most engaged followers were actually middle-aged professionals in smaller cities, not the young urban audience we’d been targeting. This completely transformed our content strategy.
For measuring audience loyalty, I’ve developed what I call the “Rule of 7”:
- How many of your last 7 posts did they engage with?
- Did they return to your profile in the last 7 days?
- Have they shared any of your content in the last 7 posts?
The hardest lesson I learned was about follower churn rate. It’s normal to lose some followers – typically 1-2% per month is natural. But when you start losing more than that, you need to investigate. I once noticed a client losing 5% of followers monthly, and after digging into the data, we realized we’d shifted too far from our core content topics. Getting back to basics brought that churn rate right down.

Here’s my tried-and-true strategy for preventing follower churn:
- Track engagement rates by content type
- Monitor unfollows after each post
- Survey your most engaged followers quarterly
- Analyze what your churned followers engaged with most before leaving
The most valuable tool in my arsenal? Cohort analysis. Start tracking when people followed you and how their engagement changes over time. I was shocked to find that followers who joined during UGC campaigns stayed 40% longer than those who came through paid ads.
Remember those confusing Instagram insights that show your “most active times”? Well, I’ve found they’re actually pretty accurate – but only if you’re posting consistently. After testing hundreds of post times, I discovered that consistency matters more than perfect timing. Choose 3-4 core posting times and stick to them.
Don’t get discouraged if your retention metrics aren’t perfect right away. Focus on creating value for your current followers rather than just chasing new ones. One of my favorite sayings is “It’s better to have 1,000 engaged followers than 10,000 ghosts.” After managing dozens of accounts, I can tell you that’s absolutely true!
And here’s something nobody tells you – sometimes a decrease in followers can actually be good for your account. I once had a client lose 2,000 followers after changing their content focus, but their engagement rate doubled because the remaining followers were more aligned with their message.
Content Performance Metrics
Let’s dive into CTR (click-through rates) first, because this metric completely changed how I approach content creation. I used to obsess over crafting the perfect post, only to realize my headlines weren’t compelling enough to make people click! Here’s the industry secret: a good CTR varies by platform, but you should aim for:
- Instagram link clicks: 1-3% is solid
- LinkedIn posts: 2-5% is great
- Facebook links: 1-2% is average
Speaking of video metrics – oh boy, did I learn these the hard way! I once spent hours creating a 5-minute video, only to discover that 70% of viewers dropped off after the first 30 seconds. Now I know that the first 3-7 seconds are absolutely crucial. Here’s what I track for every video:
- Average watch time (aim for at least 30% of total video length)
- Completion rate (15% is actually pretty good for longer videos)
- Drop-off points (pay attention to when people leave)
The most interesting thing I’ve learned about video performance? Adding captions typically increases watch time by 12% or more. I tested this across hundreds of videos, and the difference was crystal clear.
Now, about posting times – forget what you’ve read about “universal best times to post.” They don’t exist! After tracking thousands of posts, I’ve found that the best approach is to create your own heat map. Here’s how:
- Track engagement rates for every post for a month
- Note the time and day of each post
- Look for patterns in your highest-performing content
For content type comparison, I use what I call the “Rule of 10” – compare at least 10 pieces of each content type before drawing conclusions. I was shocked to find that simple text-based carousel posts often outperformed my fancy video content! Current data from my accounts shows:
- Carousel posts: Average engagement rate 4.2%
- Single image posts: Average engagement rate 3.1%
- Short-form video: Average engagement rate 3.8%
- Long-form video: Average engagement rate 2.5%
Let’s talk hashtag performance – because I totally got this wrong when I started! I used to use all 30 Instagram hashtags every time, thinking more was better. Then I actually started tracking the data. Turns out, using 5-10 highly relevant hashtags often performs better than maxing them out. Here’s my current strategy:
- Track reach from hashtags separately from overall reach
- Monitor hashtag click-through rates
- Test different hashtag groups with similar content
- Keep a spreadsheet of hashtag performance by category
The biggest revelation? Hashtags with 10,000-500,000 posts often drive more engagement than million-plus hashtag communities. They’re less competitive but still active enough to matter.
One thing that drives me nuts about content metrics is how platform algorithms change constantly. That’s why I now focus on relative performance rather than absolute numbers. If your average engagement rate is 2%, and a post gets 4%, that’s a win – regardless of what “industry standards” say.
Pro tip: Set up a simple scoring system for your content. I rate each piece on a scale of 1-5 for:
- Initial engagement (first 2 hours)
- Sustained engagement (24-hour mark)
- Share rate
- Save rate
- Comment quality
This has helped me identify patterns I never would have noticed otherwise. Who knew that posts published on Sunday evenings would consistently outperform identical content posted on Tuesday mornings? (In my niche, at least!)
Enhance your digital strategy with the SEO and Social Media Marketing EBook Sets! These insightful guides provide expert tips on boosting search engine rankings and creating engaging social media campaigns. Learn how to drive organic traffic, increase brand visibility, and convert leads into loyal customers. Perfect for entrepreneurs, marketers, and businesses aiming for online success. Start mastering digital marketing today!
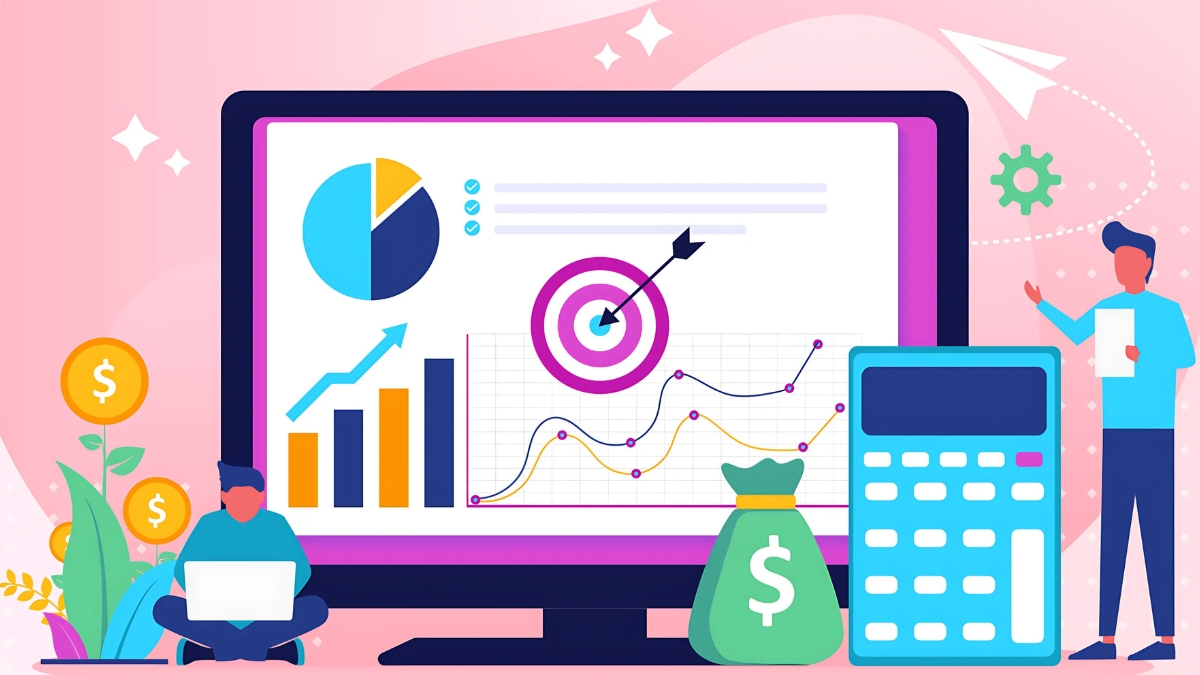
Conversion and ROI Metrics
Let me tell you about my adventures in tracking social media ROI – including the time I nearly got fired for misattributing $50,000 in conversions! That was quite the learning experience, and it taught me the importance of precise tracking.
Let’s start with calculating ROI because this is where most people (including past me) get it wrong. The basic formula seems simple: (Revenue from Social – Cost of Social) / Cost of Social x 100
But here’s the thing – you need to account for ALL costs, including:
- Ad spend
- Tool subscriptions
- Content creation time/costs
- Staff hours
- Agency fees (if applicable)
I learned to track ROI separately for each platform because the differences can be striking. For instance, LinkedIn might have a higher cost per lead, but I’ve found the conversion rate is often 2-3x higher than Facebook. Here’s what I typically see for B2B:
- LinkedIn: 5-8% conversion rate, $150-300 cost per qualified lead
- Facebook: 2-4% conversion rate, $50-100 cost per qualified lead
- Instagram: 1-3% conversion rate, $70-120 cost per qualified lead
Speaking of conversion tracking – this is where things get juicy! One game-changing discovery I made was setting up platform-specific landing pages. Instead of sending all social traffic to the same page, create unique URLs for each platform. The insights you’ll gain are incredible!
For CPC and CPM analysis, I’ve developed what I call the “Rule of Thirds”:
- Your initial campaign phase (usually highest CPC)
- Optimization phase (should see 20-30% reduction in costs)
- Scaling phase (slight increase in CPC but better qualified leads)
Here’s a real eye-opener about CPM rates – they’re not just about reach. I’ve found that a higher CPM ($15-20) targeting a super-specific audience often delivers better ROI than a lower CPM ($5-7) reaching a broader group. It’s all about who you’re reaching, not just how many.
Lead generation metrics were my biggest headache until I started tracking what I call the “qualification journey”:
- Initial click rate
- Landing page conversion rate
- Form completion rate
- Lead qualification rate
- Sales acceptance rate
Pro tip: Track your lead quality score over time. I use a simple 1-5 scale based on:
- Budget alignment
- Decision-making authority
- Timeline to purchase
- Product/service fit
Now, let’s tackle the beast that is attribution modeling. After trying every model under the sun, I’ve found that a position-based attribution model works best for most businesses. Here’s how I split it:
- 40% to first touch
- 20% to middle touches
- 40% to last touch
But here’s the kicker – you need to account for the “dark social” factor. I once discovered that 23% of our “direct” traffic was actually coming from people sharing links in private messages! To combat this, I now use UTM parameters religiously and track dark social through:
- Private share links
- Branded search volume increases
- Direct traffic spikes after social posts
The biggest mistake I see people make with conversion tracking? Not setting up proper tracking windows. If your sales cycle is 60 days, but you’re only tracking 30-day conversions, you’re missing a huge piece of the puzzle! I learned this the hard way when we almost cut a campaign that was actually our best performer – it just had a longer conversion timeline.
Remember: ROI isn’t just about direct sales. Track micro-conversions too:
- Email signups
- Resource downloads
- Webinar registrations
- Free trial activations
These often paint a more complete picture of your social media’s impact on the bottom line. In fact, I’ve found that leads who engage with at least 3 micro-conversions are 5x more likely to become customers.
Competitive Analysis Metrics
Listen, measuring share of voice used to drive me absolutely bonkers until I developed a systematic approach. The trick I discovered is to track both quantity AND quality of mentions. Here’s my tried-and-true method:
First, I track these key components:
- Brand mentions (direct and indirect)
- Hashtag usage
- Comment sentiment
- Share of industry conversations
One time, I was celebrating our “dominant” 45% share of voice, until a colleague pointed out I wasn’t tracking indirect mentions where people used industry terms instead of our brand name. Talk about a reality check! Our actual share was closer to 15%. Now I use Boolean searches to catch everything, including common misspellings.
For competitor growth rate tracking, I’ve learned to look beyond just follower counts. Here’s what really matters:
- Weekly engagement growth
- Content output rate
- Engagement per post ratio
- Follower-to-engagement correlation
I use a simple spreadsheet to track these weekly, and let me tell you – the patterns you start to see are fascinating! I once noticed a competitor’s engagement rate dropped by 50% even though their follower count was growing. Turns out they had bought fake followers (oops!).

When it comes to engagement rate benchmarking, I’ve found these averages to be pretty reliable:
- Instagram: 1-3% for larger accounts (100k+), 3-6% for smaller ones
- LinkedIn: 1-2% for company pages, 2-5% for personal profiles
- Facebook: 0.5-1% for pages with 10k+ followers
- Twitter: 0.2-0.5% for bigger accounts
But here’s the thing about benchmarking – it needs context! For instance, I discovered that B2B software companies typically see lower engagement rates but higher conversion rates compared to B2C brands. Who knew?
For content strategy analysis, I developed what I call the “Content Matrix Method”:
- Track competitor posting frequency
- Categorize content types
- Measure performance by category
- Identify content gaps
This approach led to an amazing discovery for one of my clients – while our competitors were focusing on product features, their highest-performing content was actually customer success stories. We pivoted our strategy and saw a 78% increase in engagement!
Industry-specific KPIs vary wildly, but here’s what I’ve learned to track:
- Response time to comments (aim for under 2 hours in B2C)
- Click-through rates on promotional content
- Video completion rates by industry
- Lead generation metrics specific to your sector
Pro tip: Create a monthly competitive analysis dashboard. I wasted so much time doing random spot checks until I systematized this process. Now I can spot trends before they become obvious to everyone else.
The biggest lesson I’ve learned? Don’t copy your competitors blindly. I once saw a competitor getting huge engagement with memes, tried to replicate their strategy, and fell flat on our face. Why? Because our audience was completely different! Always validate strategies against your specific audience data.
Remember, competitive analysis isn’t about obsessing over every move your competitors make – it’s about understanding the landscape so you can carve out your own unique position. Sometimes the best opportunities lie in the gaps that everyone else is missing!
Customer Service and Community Metrics
First, let’s talk about response time metrics, because this is crucial. I use what I call the “15-60-24” rule:
- Acknowledge within 15 minutes
- First response within 60 minutes
- Resolution within 24 hours
But here’s the thing about response times that nobody tells you: it’s not just about averages! I learned this after getting complaints despite our “good” average response time. Now I track:
- First response time
- Average handling time
- Resolution time
- Response consistency (variation between fastest and slowest)
For customer satisfaction, I’ve found that traditional CSAT scores only tell half the story on social media. Here’s my comprehensive tracking system:
- Quick reaction responses (👍 or 👎)
- Follow-up satisfaction surveys
- Resolution confirmation rates
- Return customer service rate (how often do people come back with new issues?)
One of my biggest “aha” moments came when tracking community participation rates. I discovered that simple engagement metrics weren’t enough. Now I look at:
- Daily active members vs. total community size
- Thread continuation rate (how many comments go beyond the first response)
- Member-to-member interaction rate
- Community-initiated discussions vs. brand-initiated
Speaking of which, I once saw our community participation rate plummet by 40%. Turns out we’d been posting so much brand content that we were drowning out community voices. Scaling back to a 70/30 split (70% community, 30% brand) brought everything back to life.
For user-generated content (UGC), I’ve developed this tracking framework:
- UGC submission rate (monthly)
- UGC sharing rate (how often others reshare)
- UGC engagement compared to brand content
- UGC conversion rate (yes, it often outperforms professional content!)
Pro tip: Create a UGC leaderboard for your most active contributors. I’ve found that recognizing top contributors can increase overall UGC submission rates by up to 60%.
Now, brand sentiment analysis – this is where things get really interesting! After trying various tools, I’ve found the most reliable method is a combination of automated and manual tracking:
- Automated sentiment scoring (positive/negative/neutral)
- Emotion categorization (joy, frustration, confusion, etc.)
- Context analysis (what triggered the sentiment?)
- Sentiment trend tracking over time
Here’s a fascinating discovery: negative comments that receive quick, helpful responses often lead to higher overall brand sentiment than purely positive interactions. It’s all about how you handle the situation!
I track what I call “sentiment velocity” – how quickly sentiment changes after specific events or responses. For instance, I noticed that addressing negative comments within 30 minutes typically leads to a sentiment reversal 65% of the time.
Remember that weird week when everyone seemed angry on social media? I learned to track external factors that might affect sentiment:
- Industry news
- Competitor actions
- Seasonal trends
- Platform changes
The most valuable metric I’ve found for community health is what I call the “return rate” – how often do people come back to participate? A healthy community should see:
- 20% daily returners
- 40% weekly active members
- 70% monthly active participants
These numbers might seem low, but they’re actually pretty good benchmarks based on my experience across different industries.
One final tip: Don’t get too caught up in the negative metrics. I used to obsess over every negative comment until I realized that a healthy community actually needs some constructive criticism to grow. Now I aim for an 80/20 ratio of positive to constructive feedback – it keeps things real while maintaining a positive atmosphere.
Transform your social media strategy by focusing on these crucial analytics metrics. Remember, successful social media management isn’t just about tracking numbers – it’s about understanding the story behind the data and using those insights to make informed decisions. Start implementing these measurement techniques today, and watch your social media effectiveness soar.
Tired of the traditional 9–5 grind and looking for a more flexible way to earn money online? There are now real opportunities that allow you to work from anywhere—whether it’s answering emails, doing basic admin tasks, or helping businesses with simple online duties. You don’t need special skills or a degree—just a willingness to learn and a few hours a week. Take control of your schedule and start getting paid for remote tasks today—perfect for beginners who want real results without the stress. CLICK HERE!


You May Also Like

How to Sell Digital Resources on Boom Learning in 2025: A Complete Guide for Teachers

How to Create AI YouTube Videos Without Showing Your Face in 2025: Complete Guide